Linaer regression
In this section, we will review regression from a statistical perspective. For a machine learning perspective, see the machine learning section.
The main goal is to find the best line that fits the data. For instance, consider the following figures constructed using World Bank data.

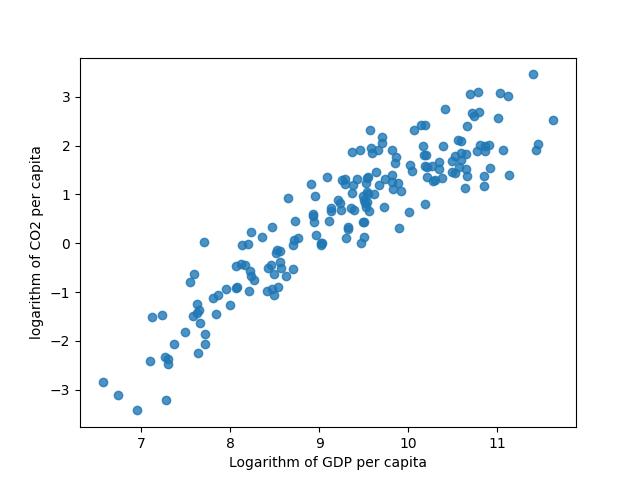
The problem in each dataset consists of finding a linear approximation \(\hat{y}_{i}\) of the true value \(y_{i}\), where the error is measured as \(u_{i}^{2} = (y_{i} - \hat{y}_{i})^{2}\).


Here, we see that the values \(\beta_{0}\) and \(\beta_{1}\) that solve the problem can be obtained using two methods: Maximum Likelihood Estimation and the Least Squares Method. Both methods yield similar results.
Slides
Model |
Material |
|---|---|
Introduction to linear regression |
|
Linear regression notebook |
|
Excercise linear regression |
|
Introduction to dummy variables |
|
Multicollinearity |
|
Assumptions |
|
Assumptions |
|
Especification |